
In this infographic, we illustrate some of our key findings on how investment platforms fared since the pandemic-induced boom.
As another year draws to a close, we thought we’d revisit our platform stats infographic from the spring and, having trawled through the published platform results for 2022, look at just how they fared. It’s not quite a story of boom to bust, but platforms certainly came away a little battered and bruised…
Download our new infographic – Platform Assets Take a Hit.
Platform industry cost in bps
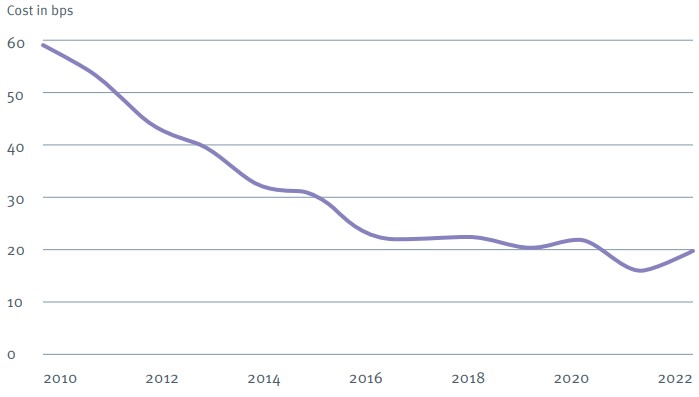
This time around, our analysis shows that the cost of running a platform, when expressed in bps per £AuA ticked up year on-year, sitting at just shy of 20bps at the end of 2022.
Total AuA has shrunk, however revenue has risen
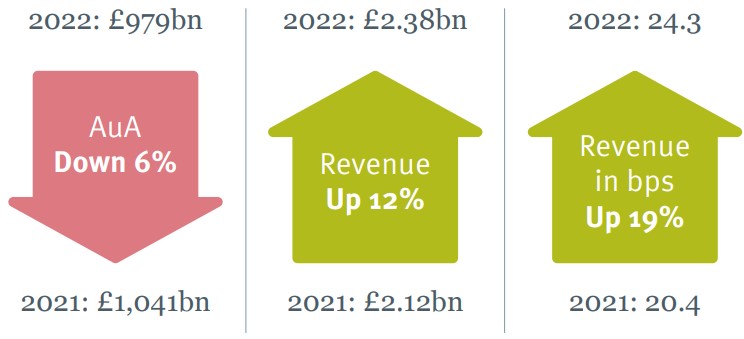
Having benefited from inflated asset valuations and investors with spare change during the pandemic years, 2022 was an altogether different story. A cost-of-living crisis, numerous macro-economic shocks and the ill-fated autumn mini-budget all led to a fall in platform market AuA.