In this infographic, we illustrate some of our key findings on how investment platforms fared during ‘the pandemic years’.
When we last visited the topic of platform profitability in our 2020 infographic things were looking up in platform land. What was still unknown at the time of publication, however, was what the impact of COVID 19 and its associated operational challenges would be on platforms’ bottom lines. So, just over 2 years on from our last analysis, we thought we’d take another look at the numbers and see how they fared during ‘the pandemic years’.
Platform Industry Cost in Bps
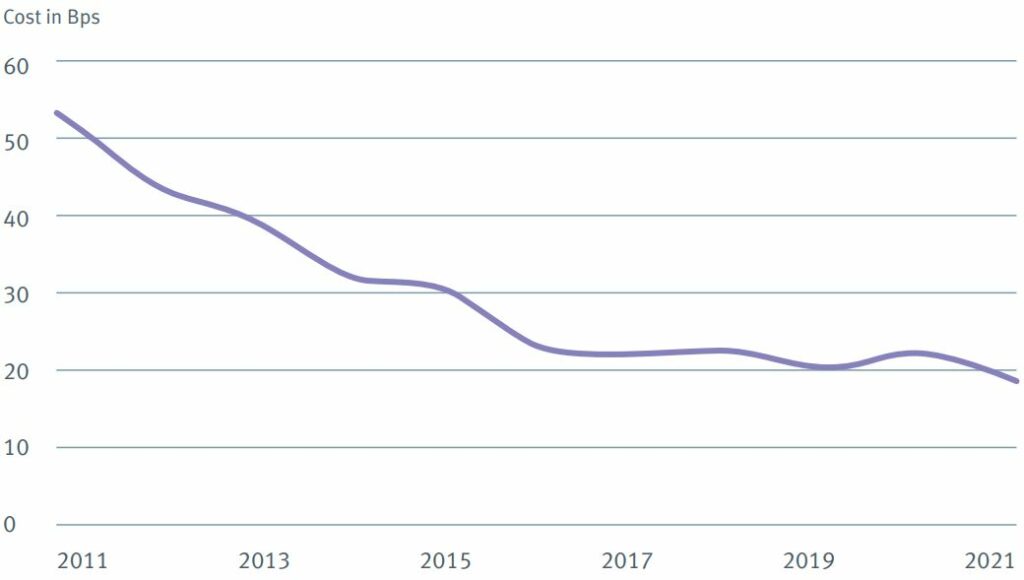
Once again, our analysis shows that the cost of running a platform, when expressed in bps per £AuA has continued to fall since 2019, sitting at 18.5bps at the end of 2021.
Total AUA has boomed, however revenue in Bps has continued to fall
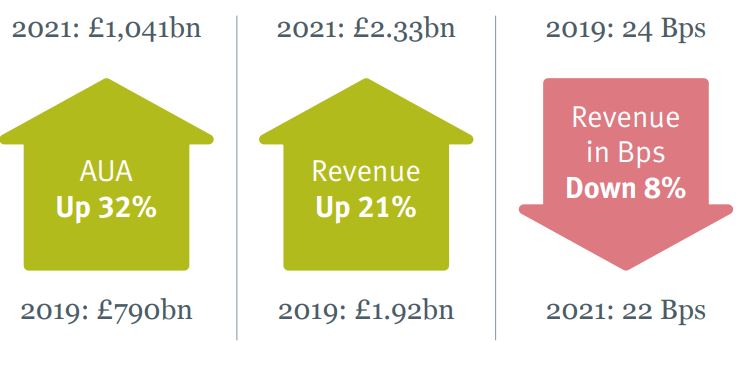
It’s been well publicised that the UK retail investment platform space was one of the sectors to benefit during the pandemic, for a host of reasons, with the value of assets sitting on them reaching north of £1trn by the end of 2021. Perhaps unsurprisingly though, revenue growth was unable to keep pace and once more we see revenue in Bps has fallen further since 2019.