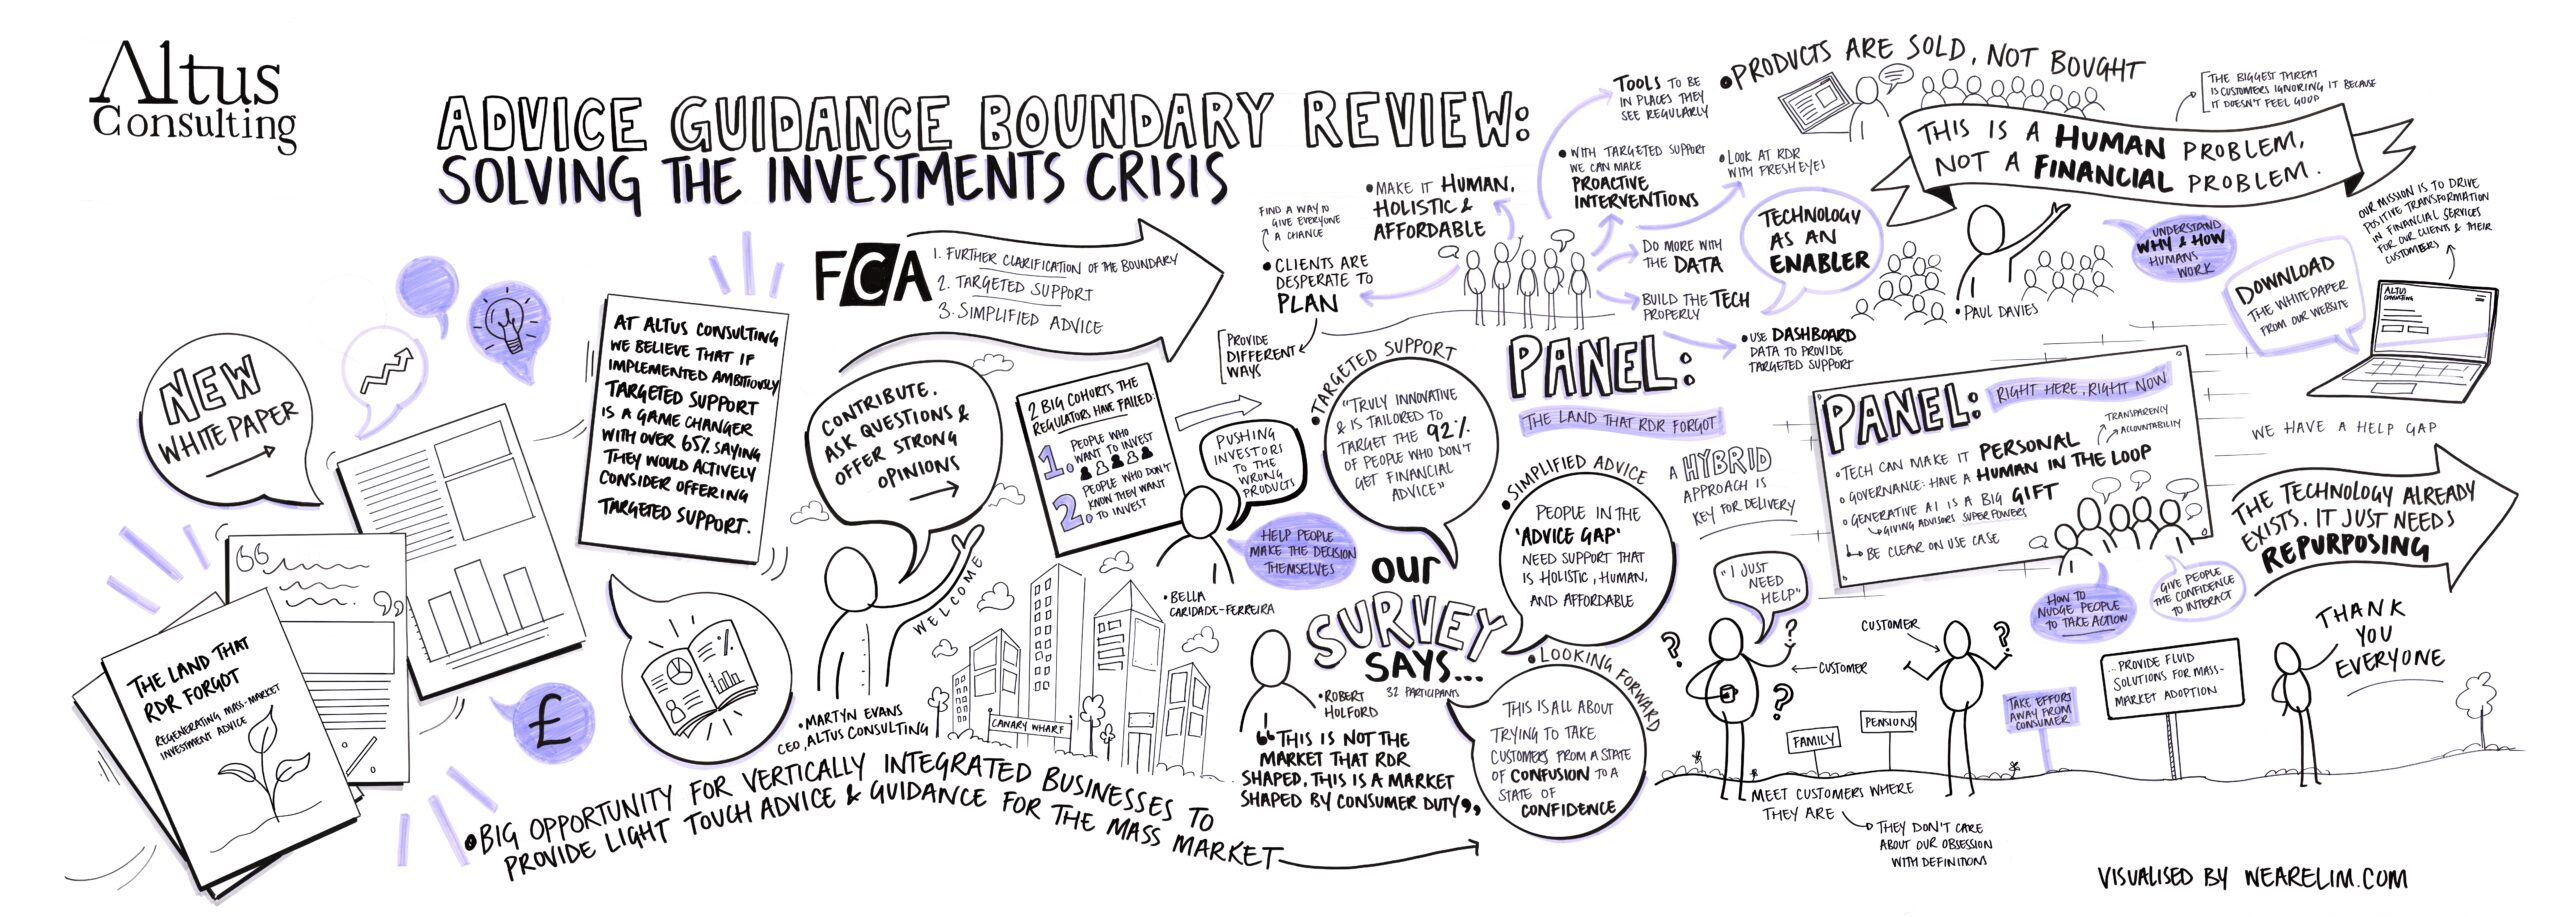

In this infographic, we illustrate some of our key findings on how platforms fared having taken a hit.
It’s that time of year again! As 2024 draws to a close, we’ve dived back into our platform stats once more, and, having worked our way through the published platform results for 2023, looked at how the industry fared following a tough 2022.
Download our new infographic – Platform Assets Pick Themselves Up Off The Canvas
Platform industry costs in bps
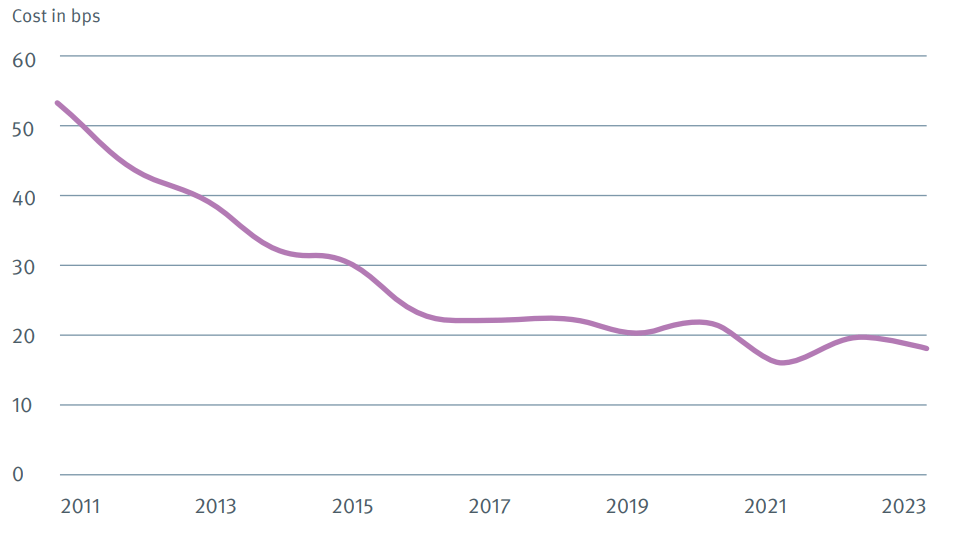
Our analysis shows that the cost of running a platform, when expressed in bps per £AuA, fell year-on-year, sitting at just shy of 18.5bps at the end of 2023.
Total AuA and revenue in bps both moving in right direction
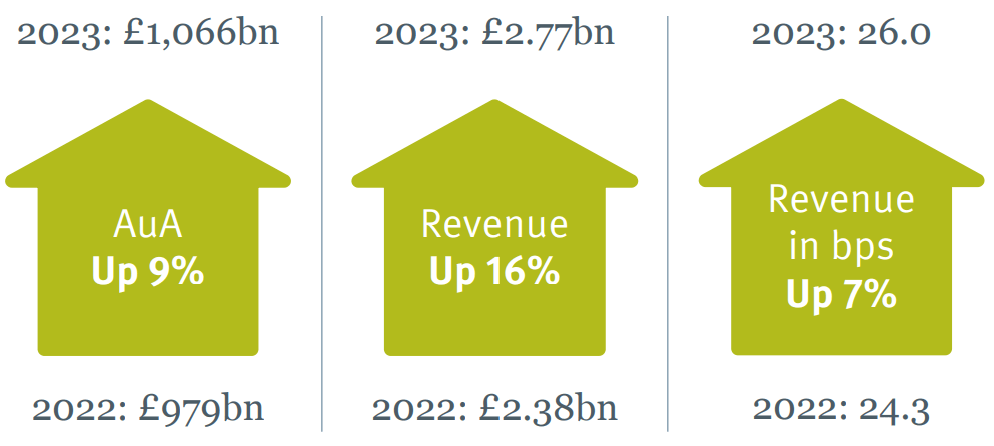
In the wake of falling markets and depressed asset valuations at the end of 22′, 2023 provided some light relief when it came to platform market AuA. Whilst it was undeniably a year to forget for many platforms on the flows front, rallying markets pushed industry asset levels to their highest on record.